AI & Data
FreeSpreadsheets for Data Analysis
Turn messy spreadsheet data into clean tables, summaries, and charts using Excel and Google Sheets.
Beginner · 13 lessons · 7 hours · English + Urdu
AI & Data
Turn raw data into decisions with spreadsheets, SQL, Python and dashboards.
16 weeks at ~2 hours/day · Beginner · 7 skills · Free
A data analyst turns raw numbers — sales, users, operations — into answers a business can act on. This roadmap teaches the analyst's toolkit in order: spreadsheets first, then SQL, then Python for data, then dashboards and storytelling with data, in about 16 weeks at two hours a day, using real-style datasets throughout.
Weeks 1–4
Project: Analyse a messy sales dataset end-to-end
Weeks 5–8
Project: Ten business questions answered in SQL
Weeks 9–12
Project: A complete analysis notebook
Weeks 13–16
Project: An interactive dashboard with a written report
AI & Data
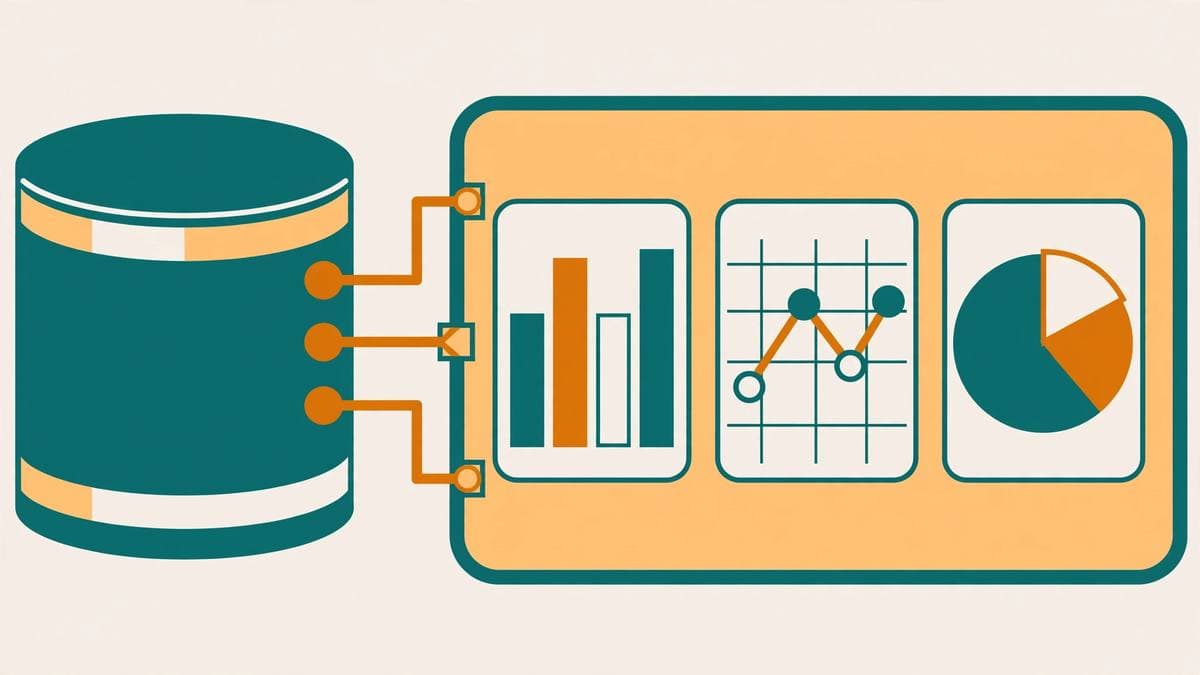
FreeTurn messy spreadsheet data into clean tables, summaries, and charts using Excel and Google Sheets.
Beginner · 13 lessons · 7 hours · English + Urdu
AI & Data
FreeAsk questions of real databases with SQL, then turn the answers into clear dashboards and charts.
Intermediate · 12 lessons · 9 hours · English
They need some. Spreadsheets and SQL cover much of daily analyst work, and Python makes you faster and opens better roles. This roadmap introduces them in that order, so nothing feels like a jump.
Analysts focus on understanding what happened and what a business should do next, using data from existing systems. Data scientists build predictive models and need deeper statistics and ML. Analyst is the common entry point into data careers.
Spreadsheets first — they teach you how data is structured and cleaned, and every company uses them. SQL comes right after, in weeks 5–8, once data thinking is in place.
Four finished pieces: a spreadsheet analysis, a set of answered SQL business questions, a Python analysis notebook, and an interactive dashboard with a short report — exactly what hiring managers ask to see.